Cardano Node Security Monitoring
Modern security practices require a balanced focus between prevention, detection and response capabilities.
Implementing Cardano Node on Linux gives a secure base to start, with some basic things that should be in place to lock down access for relays and block producing nodes:
-
Set a strong password for user accounts.
-
Only allow SSH authentication by certificates (
sudo nano /etc/ssh/sshd_configand setPasswordAuthentication no). -
Only run services that you need on the server. Disable anything that is not required.
-
Segregate services behind host based or network firewalls (preferably both), only allow stateful inbound SSH connections from trusted hosts, inbound connection to relay nodes on the defined port, and only allow inbound connection to BPN from specific relay nodes (outbound is needed from relays).
-
Set appropriate permissions for files (e.g.
/opt/cardano/cnodeif you are using cnTools, which will also set the correct permissions for you). -
Lastly, keep the base operating systems patched (e.g.
sudo apt update/upgrade) and scan for vulnerabilities (e.g. Nessus).
But even the best security defences can be breached. And this is where detection and response becomes important. While there are a lot of security products that you can buy in the market to help with detection, there are also some good open source options. One of those is OSSEC.
OSSEC provides a Host Based Intrusion Detection (HIDS) solution for Linux, Mac and Windows which is agent based and reports back to a server. It’s a lightweight solution, with a range of detection rules, and is actively developed.
One of the negatives is that it doesn’t have a nice GUI, but by adding Prometheus and Grafana we can fix that. We can also tune the detection rules to monitor specific Cardano node directories.
Building cnhids (in homage to cntools)
Installing cnhids is now as simple as running the script after downloading from GitHub:
https://github.com/adavault/cnhids
We do not recommend using the manual process and it will no longer be maintained (as the install script self documents).
Manual build process
There are quite a few steps to this so it’s worth sumarising what you are going to do:
-
Setup the OSSEC server on a separate 20.04 LTS instance.
-
Configure promtail, loki to scrape logs from OSSEC
-
Setup Prometheus and Grafana to collect the data and display on our cnHids dashboard
-
Setup a custom metrics service to scrape info on total agents and active agents
-
Configure the OSSEC agents and connect them to the OSSEC server.
Software components:
-
Ubuntu Server 20.04LTS.
Improvement areas:
-
Packages are running from /var and /opt which is good, but this installation process could be more scripted, (we figured if there is enough interest we will check with GuildOps to see if they want to include as an install script there). However it’s perfectly usable and secure as is.
-
At the moment there is no alerting, but this could be added to prometheus.
Allow a couple of hours to build and configure this for your environment.
Pre-requisites
We recommend running this on a separate server instance (1CPU core, 2GB RAM, 50-100GB disk), ideally in a separate firewall zone (The OSSEC manager listens on UDP port 1514, so you will need to allow UDP 1514 inbound so the agents can connect to the server). This server will also run the Prometheus and Grafana instances and the log collectors/scrapers. These should all be bound to localhost expect for Grafana (0.0.0.0) as you will want to be able to connect to that remotely on the port configured (3000 by default).
Assuming a fresh install of 20.04 on a server with an FQDN cnhids-server we create a user cnhids and directory structure as follows:
#Create a user and add them to sudoers
sudo adduser cnhids
sudo usermod -aG sudo cnhids
#Log off then log back on as cnhids (while you are at it why not copy over ssh keys) exit ssh-copy-id cnhids@cnhids-server ssh cnhids@cnhids-server
#Create directory structure (aligned with cnTools) sudo mkdir -p /opt/cardano/cnhids #Change owner and group to cnhids sudo chown cnhids /opt/cardano/cnhids sudo chgrp cnhids /opt/cardano/cnhids
Install OSSEC Server
Next we set up the basic OSSEC server install:
cd ~
sudo apt update
sudo apt upgrade
sudo apt install gcc make libevent-dev zlib1g-dev libssl-dev libpcre2-dev wget tar unzip -y
wget https://github.com/ossec/ossec-hids/archive/3.6.0.tar.gz
tar xzf 3.6.0.tar.gz
cd ossec-hids-3.6.0/
sudo ./install.sh
#Follow the prompts to install server version of OSSEC
(en/br/cn/de/el/es/fr/hu/it/jp/nl/pl/ru/sr/tr) [en]:
…
Now edit the default ossec.conf to add json output.:
sudo nano /var/ossec/etc/ossec.conf
In this case we have removed the email notification but you could choose to keep that. The Save and exit, then restart the OSSEC server:
Now you have the basic OSSEC server in place it's time to collect data from the logs for Prometheus to store. Let's install Promtail first:
Create the yaml:
...paste in this config (change your timezone location as needed) and save:
positions:
filename: /var/ossec/logs/alerts/promtail_positions.yaml clients: scrape_configs: Next register as a service (create the systemd service definition):
...then paste the following into the file and save it:
[Service]
Type=simple
User=root
ExecStart=/opt/cardano/cnhids/promtail/promtail-linux-amd64 -config.file promtail.yaml
WorkingDirectory=/opt/cardano/cnhids/promtail/
Restart=always
RestartSec=10 [Install]
WantedBy=multi-user.target Now copy it across to systemd:
The Loki setup follows a similar process:
Create the yaml:
...and paste this config into it, then save. You can increase the retention period but will need choose certain multiples of the schema period, these are set to give you about a months retention.
server:
http_listen_port: 3100 ingester:
lifecycler:
address: 127.0.0.1
ring:
kvstore:
store: inmemory
replication_factor: 1
final_sleep: 0s
chunk_idle_period: 1m
chunk_retain_period: 30s schema_config:
configs: storage_config:
boltdb:
directory: /opt/cardano/cnhids/loki/index filesystem:
directory: /opt/cardano/cnhids/loki/chunks limits_config:
enforce_metric_name: false
reject_old_samples: true
reject_old_samples_max_age: 192h chunk_store_config:
max_look_back_period: 0 table_manager:
chunk_tables_provisioning:
inactive_read_throughput: 0
inactive_write_throughput: 0
provisioned_read_throughput: 0
provisioned_write_throughput: 0
index_tables_provisioning:
inactive_read_throughput: 0
inactive_write_throughput: 0
provisioned_read_throughput: 0
provisioned_write_throughput: 0
retention_deletes_enabled: true
retention_period: 768h Next we register as a service, create the service definition:
...then paste the following into the file and save it:
[Service]
Type=simple
User=cnhids
ExecStart=/opt/cardano/cnhids/loki/loki-linux-amd64 -config.file loki-config.yaml
WorkingDirectory=/opt/cardano/cnhids/loki/
Restart=always
RestartSec=10 [Install]
WantedBy=multi-user.target Lastly copy the service across to systemd:
The prometheus install is pretty standard, we can use the latest version from the repo:
Edit the .yaml, we just need to add some scrape configs at the end, otherwise it's as default
And edit so it looks like this (the only bit to change is adding the scrapes at the end):
alerting:
alertmanagers: rule_files: scrape_configs: job_name: ‘prometheus’ static_configs: job_name: ‘ossec’
static_configs: job_name: ‘ossec-metrics’
static_configs: job_name: ‘loki’
static_configs: Create the service definition:
...and paste in this content then save:
[Service]
Type=simple
User=cnhids
ExecStart=/opt/cardano/cnhids/prometheus-2.24.1.linux-amd64/prometheus –storage.tsdb.retention.time=30d
WorkingDirectory=/opt/cardano/cnhids/prometheus-2.24.1.linux-amd64/
Restart=always
RestartSec=10 [Install]
WantedBy=multi-user.target Lastly copy across to systemd:
It's a vanilla install for Grafana:
Create the service definition:
...and paste this in then save:
[Service]
Type=simple
User=cnhids
ExecStart=/opt/cardano/cnhids/grafana-7.3.7/bin/grafana-server
WorkingDirectory=/opt/cardano/cnhids/grafana-7.3.7/
Restart=always
RestartSec=10 [Install]
WantedBy=multi-user.target ..and copy across to systemd:
There's no easy way to scrape the agents information by tailing the OSSEC logs but fortunately Ed Welch has built a simple app called [ossec-metrics](https://github.com/slim-bean/ossec-metrics) to execute some OSSEC commands and parse the output.
The setup is a little more involved as we need to compile it using go-lang. Now create the service definition as usual
...and paste in and save:
[Service]
Type=simple
User=root
ExecStart=/opt/cardano/cnhids/ossec-metrics/ossec-metrics
WorkingDirectory=/opt/cardano/cnhids/ossec-metrics/
Restart=always
RestartSec=10 [Install]
WantedBy=multi-user.target Copy across to systemd:
Let's test the services one by, for each service you should get a clean start and no errors. If you do go back and check that service:
Assuming they all started successfully then set them to start at boot:
Almost done, time to get a cup of tea and take a break....
The last step of this section is to log-on to Grafana and add the dashboard. Open your browser and navigate to: The default user is admin and empty password, Grafana will ask you to set a password. Once you have logged into Grafana add two new datasources. First a Prometheus datasource:
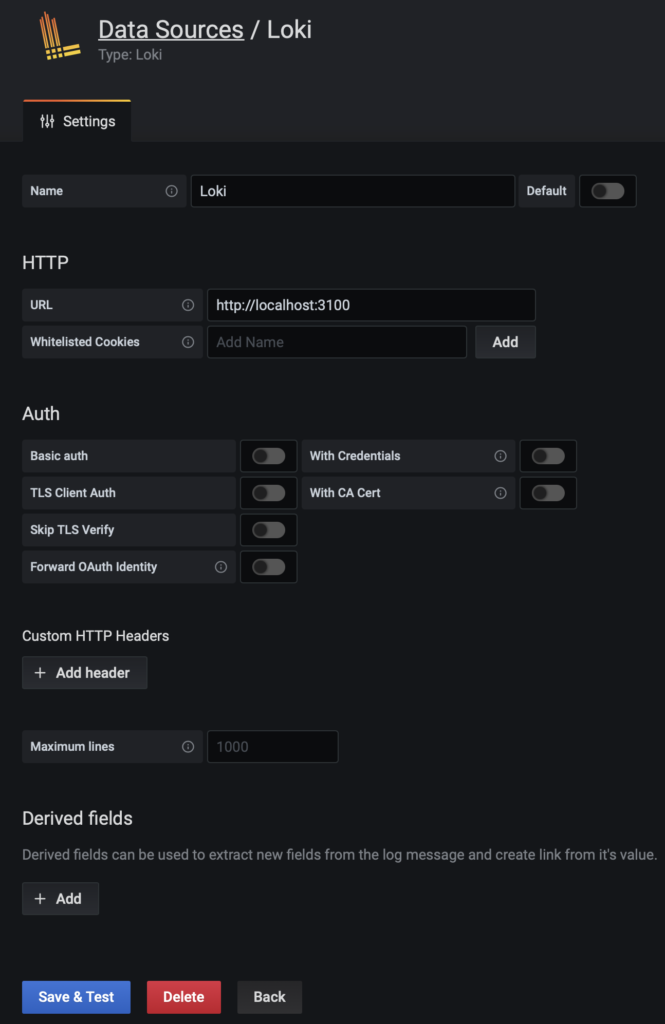
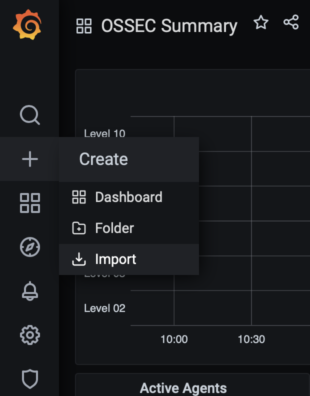
Then a Loki datasource: Now you can import the dashboard by hovering over the + symbol on the left panel and selecting import then pasting in this json file. And you should have a dashboard with some content populating from the OSSEC server. At the moment you only have one agent reporting which is on the OSSEC server itself. So the last steps are to add agents on the servers you want to monitor and then connect them to the OSSEC server. SSH to the server you want to add the agent to then: Follow the prompts:
At this time we don't suggest enabling active response as you don't want to inadvertently stop your node from producing a block at a critical time if the network host gets blocked. If use becomes more widespread and we get confident this is safe then this may change.
Make a note of the client ip ( (A)dd an agent (A).
(E)xtract key for an agent (E).
(L)ist already added agents (L).
(R)emove an agent (R).
(Q)uit.
Choose your action: A,E,L,R or Q: a Confirm adding it?(y/n): y
Agent added with ID 001.
Extract the key with 'e', and copy this, run the same process on the agent:
If you are monitoring a cardano node then open the ossec.conf files and add cnode dirs (the paths are set assuming you are using using cnTools):
Add the following lines to the file below the existing directory lines...
Lastly restart the agent (if it's the first agent you've added you will need to restart the OSSEC server as well with this command):
You should see the agent appear on the dashboard within a couple of minutes, it will spend a little while setting scanning the server before it reports in to the OSSEC server. If its not there after 10 minutes check firewall ports aren't blocking traffic.
Repeat for each server you want to monitor. This guide was inspired by: sudo /var/ossec/bin/ossec-control restartSetup Promtail and Loki
cd /opt/cardano/cnhids
mkdir promtail
cd promtail/
wget https://github.com/grafana/loki/releases/download/v2.1.0/promtail-linux-amd64.zip
unzip promtail-linux-amd64.zip
chmod +x promtail-linux-amd64nano promtail.yamlserver:
http_listen_port: 8080
grpc_listen_port: 0
The host is wrapped in parens, extract just the string and essentially strip the parens
source: host
expression: ‘^((?PPad the level with leading zeros so that grafana will sort the levels in increasing order
source: level
template: ‘{{ printf “%02s” .Value }}’Set labels for level, group, and host
level: ‘’
group: ‘’
host: ‘’
application: ‘’
srcuser: ‘’
dstuser: ‘’Set the timestamp
source: timestamp
format: UnixMsExport a metric of alerts, it will use the labels set above
ossec_alerts_total:
type: Counter
description: count of alerts
source: level
config:
action: inc
static_configs:
The firewall log is not JSON, this regex will match all the parts and extract the groups into extracted data
expression: ‘(?PThis will match host entries that are wrapped in parens and strip the parens
source: host
expression: ‘^((?PSome hosts are in the format
source: host
expression: ‘^(?Possec -> ... this will match those and only return the host nameForce the action (DROP or ALLOW) to lowercase
source: action
template: ‘{{ .Value | ToLower }}’Force the protocol to lowercase
source: protocol
template: ‘{{ .Value | ToLower }}’Set labels for action, protocol, and host
action: ‘’
protocol: ‘’
host: ‘’Set the timestamp, we have to force the timezone because it doesn’t exist in the log timestamp, update this for your servers timezone
source: timestamp
format: ‘2006 Jan 02 15:04:05’
location: ‘Europe/London’Export a metric of firewall events, it will use the labels set above
ossec_firewall_total:
type: Counter
description: count of firewall events
source: action
config:
action: inc
static_configs:
nano promtail.service[Unit]
Description=Promtail Loki Agent
After=loki.servicesudo cp promtail.service /etc/systemd/system/promtail.servicecd /opt/cardano/cnhids
mkdir loki
cd loki
mkdir chunks
mkdir index
wget https://github.com/grafana/loki/releases/download/v2.1.0/loki-linux-amd64.zip
unzip loki-linux-amd64.zip
chmod +x loki-linux-amd64nano loki-config.yamlauth_enabled: false
nano loki.service[Unit]
Description=Loki Log Aggregator
After=network.targetsudo cp loki.service /etc/systemd/system/loki.serviceInstall Prometheus
cd /opt/cardano/cnhids
wget https://github.com/prometheus/prometheus/releases/download/v2.24.1/prometheus-2.24.1.linux-amd64.tar.gz
tar -zxvf prometheus-2.24.1.linux-amd64.tar.gzcd prometheus-2.24.1.linux-amd64/
nano prometheus.yml# my global config
global:
scrape_interval: 15s # Set the scrape interval to every 15 seconds. Default is every 1 minute.
evaluation_interval: 15s # Evaluate rules every 15 seconds. The default is every 1 minute.scrape_timeout is set to the global default (10s).
Alertmanager configuration
- alertmanager:9093
Load rules once and periodically evaluate them according to the global ‘evaluation_interval’.
- “first_rules.yml”
- “second_rules.yml”
A scrape configuration containing exactly one endpoint to scrape:
Here it’s Prometheus itself.
The job name is added as a label
job=<job_name> to any timeseries scraped from this config.
metrics_path defaults to ‘/metrics’
scheme defaults to ‘http’.
nano prometheus.service[Unit]
Description=Prometheus Metrics
After=network.targetsudo cp prometheus.service /etc/systemd/system/prometheus.serviceSetup Grafana
cd /opt/cardano/cnhids
wget https://dl.grafana.com/oss/release/grafana-7.3.7.linux-amd64.tar.gz
tar -zxvf grafana-7.3.7.linux-amd64.tar.gzcd grafana-7.3.7
nano grafana.service[Unit]
Description=Grafana UI
After=network.targetsudo cp grafana.service /etc/systemd/system/grafana.serviceSetup up the custom OSSEC-metrics scrapper
cd /opt/cardano/cnhids
sudo apt install golang-go
mkdir ossec-metrics
cd ossec-metrics/
wget https://github.com/slim-bean/ossec-metrics/archive/v0.1.0.tar.gz
tar -zxvf v0.1.0.tar.gz
cd ossec-metrics-0.1.0/
go build -o ossec-metrics cmd/ossec-metrics/main.go
mv ossec-metrics ../
cd ..
chmod +x ossec-metricsnano ossec-metrics.service[Unit]
Description=Ossec Metrics exposes OSSEC info for prometheus to scrape
After=network.targetsudo cp ossec-metrics.service /etc/systemd/system/ossec-metrics.serviceFinal configurations
sudo systemctl daemon-reload
sudo systemctl start prometheus.service
sudo systemctl status prometheus.service
sudo systemctl start loki
sudo systemctl status loki
sudo systemctl start promtail
sudo systemctl status promtail.service
sudo systemctl start ossec-metrics.service
sudo systemctl status ossec-metrics.service
sudo systemctl start grafana.service
sudo systemctl status grafana.servicesudo systemctl enable prometheus.service
sudo systemctl enable loki.service
sudo systemctl enable promtail.service
sudo systemctl enable ossec-metrics.service
sudo systemctl enable grafana.serviceDashboards
https://cnhids-server:3000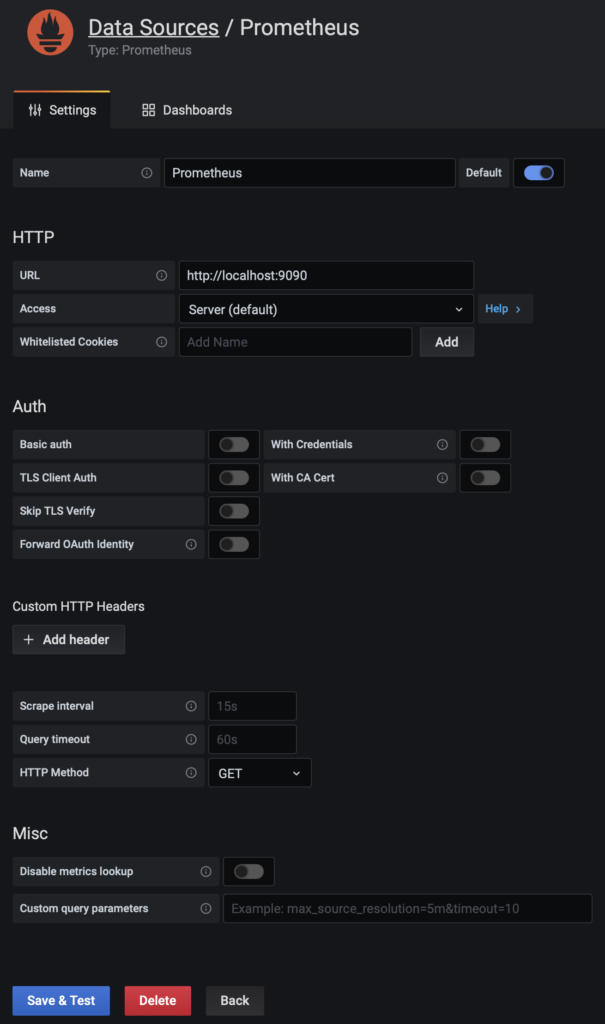
Add some agents
cd ~
sudo apt install gcc make libevent-dev zlib1g-dev libssl-dev libpcre2-dev wget tar -y
wget https://github.com/ossec/ossec-hids/archive/3.6.0.tar.gz
tar xzf 3.6.0.tar.gz
cd ossec-hids-3.6.0/
sudo ./install.sh(en/br/cn/de/el/es/fr/hu/it/jp/nl/pl/ru/sr/tr) [en]: en
1- What kind of installation do you want (server, agent, local, hybrid or help)? agent
2- Choose where to install the OSSEC HIDS [/var/ossec]: /var/ossec
3.1- What’s the IP Address or hostname of the OSSEC HIDS server?: cnhids-server
3.2- Do you want to run the integrity check daemon? (y/n) [y]: y
3.3- Do you want to run the rootkit detection engine? (y/n) [y]: y
3.4 - Do you want to enable active response? (y/n) [y]: nip a) then SSH to the OSSEC server and register the agent:sudo /var/ossec/bin/manage_agents
sudo /var/ossec/bin/manage_agents
#And follow the prompts to paste the key in and register the agentsudo nano /var/ossec/etc/ossec.confsudo /var/ossec/bin/ossec-control restartThanks go to….